- Improve nhibernate performance
- Optimize queries
- Fix bottlenecks
- Save countless hours


Speed up your app!
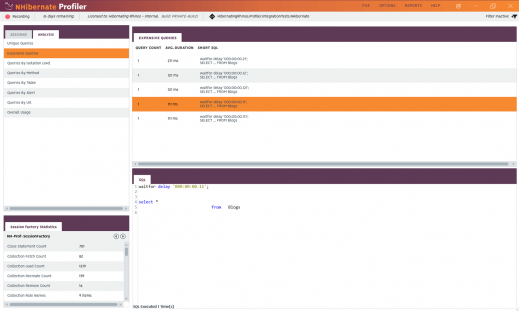
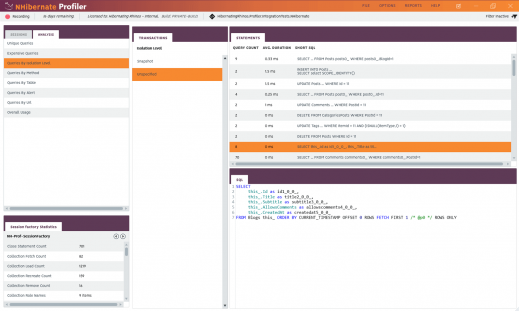
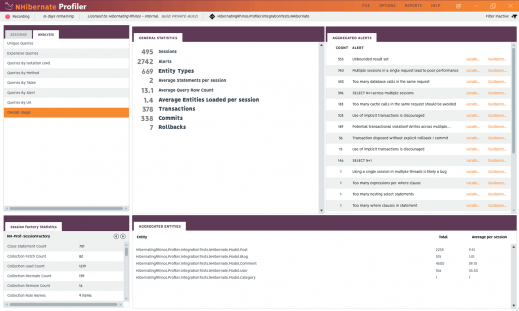
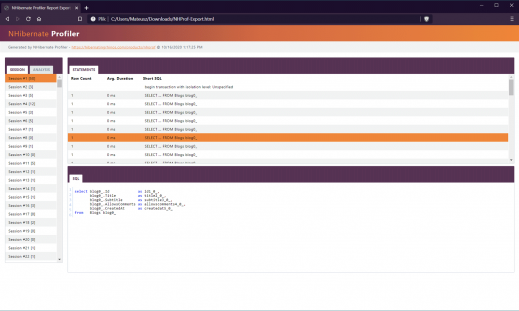
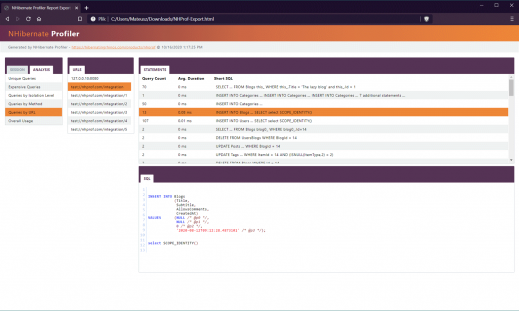
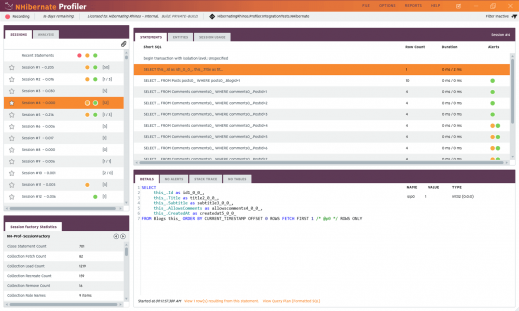
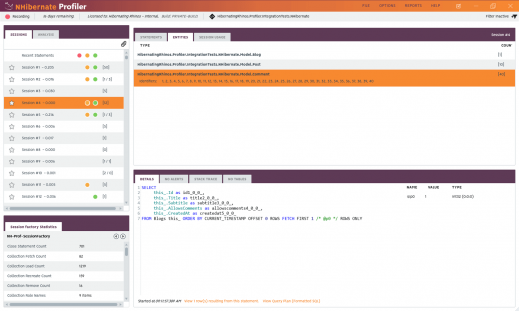
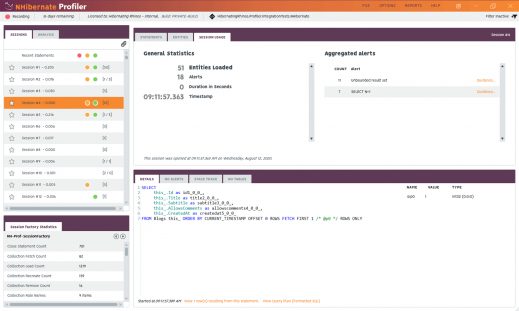
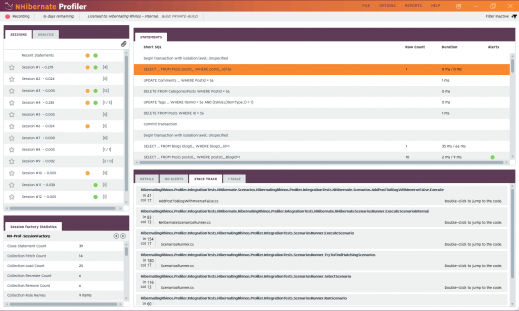
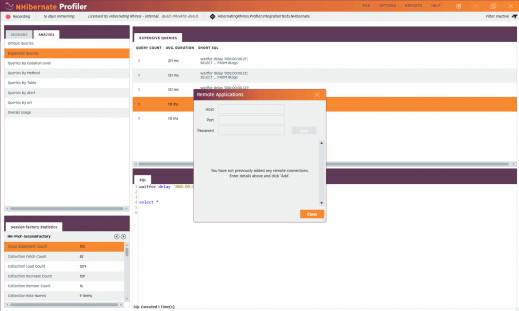
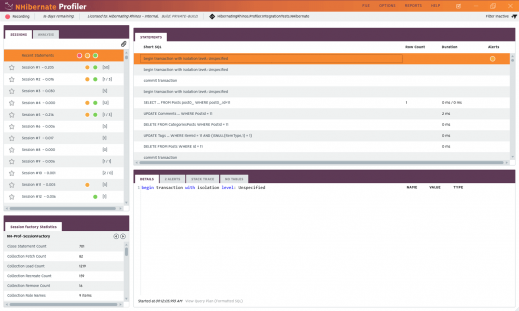
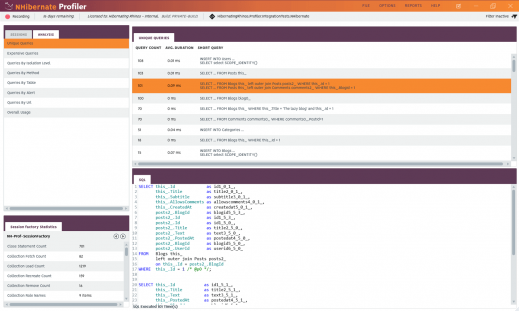
NHibernate Profiler is a real-time visual debugger allowing a development team to gain valuable insight and perspective into their usage of NHibernate.
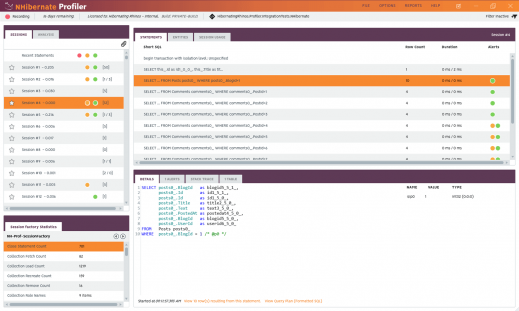
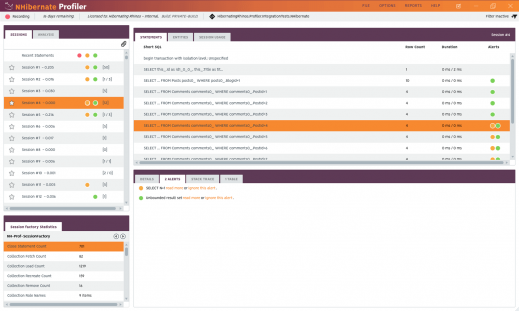
The product is architected with input coming from many top industry leaders within the NHibernate community. Alerts are presented in a concise code-review manner indicating patterns of misuse by your application. To streamline your efforts to correct the misuse, we provide links to the problematic code section that triggered the alert.
 Cognitive application awareness.
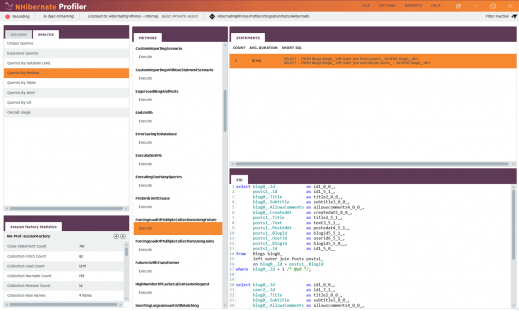
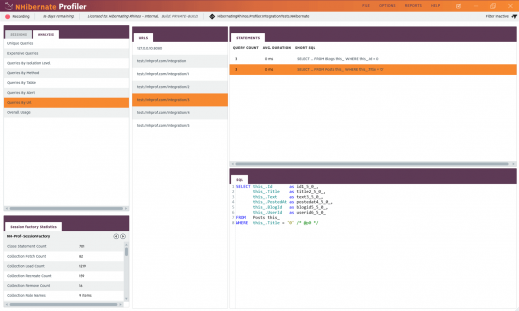
 Visual insight into the interaction between your database and application code.
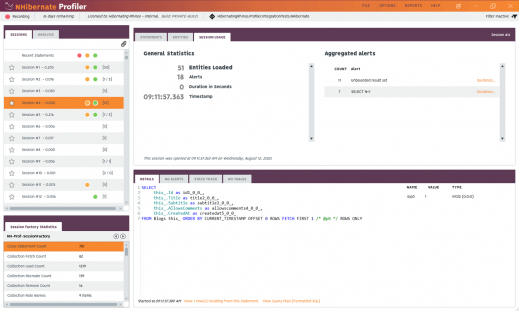
 Analysis and detection of common pitfalls when using Nhibernate.
 Analysis is delivered via perfectly styled SQL and linkable code execution.
 Supports NHibernate 1.2.x, 2.x, 3.x, 4.x and 5.x
New in 6.0
What our customers say
I have used NHibernate Profile on two large scale and high profile projects at two separate companies. **As CodeReadySolutions**, VP of Development: We built a stock analysis system that computes and performs adhoc searches against various stock metrics built around Phil Town’s stock investing philosophy. Every query was tuned so that 95% of all queries were executed in less than 20 milliseconds and the remaining 5% completed in less than 100ms. Even with the high volume of users, every UI refresh (including spring and the web ui) completed in less than 1 second. Most of the time the screen refreshes appears to be instantaneous. What a huge win? Performance was never a question. This was due largely to the visibility provided by NhibernateProfiler. **As MyDealerLot RFID Solutions**, Chief Technology Officer: The principle job after starting at MyDealerLot was to fix scalability issues in the platform that were raised through VC funding. We worked around the clock for 3 months to fix the scalability issues by rewriting the entire application from scratch. NHibernateProfiler was key to nailing the performance issues. 95% of all [Spring.net](http://spring.net/) / NHibernate queries execute in < 10 milliseconds. %5 execute in < 25 milliseconds. I do not believe that we would have achieved such a high performing system without NHibernateProfiler. One of the serious great as aspect is showing both database time as well as the serialization time. Most profiling tools are finicky and require a lot of babying. This tool runs round the clock on my development system. It gets restarted when there are patches. I have never had a crash and it regularly runs 10 days or so at a clip in between Microsoft updates. I would have been in reading through thousands / millions of lines in the SQLProfiler and try to figure out what it was matched up to in the NHibernate layer. This takes you to the exact line in the C# code. What an incredible tool!
David Strickland
Chief Technology OfficerAfter seeing NHProfiler in action for the first time I was completely blown away! I ran the profiler against a content management system which I was developing and quickly identified a number of queries that could be optimised resulting in a significant increase in performance. This is not only a great tool for debugging, developing and scaling data driven applications but it also helps me to have a deeper understanding of the NHibernate framework. I now consider NHProfiler a must have tool when using NHibernate.
Dan Watson
Software DeveloperAs a consultant working with companies to introduce new technologies it is essential that I not only satisfy the requirements of a project, but ensure it’s development meets strict standards. Always an advocate of knowing what’s happening “under the hood” the hidden nature of ORM’s (such as NHibernate) has always been a stumbling block, especially when teaching best practices and impressing the importance of performance on developers. With NHProf you have given me the perfect tool to show the inner workings of NHibernate, and through it’s ‘alerts’ feature and relating WIKI, provided excellent reference material in fine-tuning performance. I am in no doubt that NHProf in an essential tool for any developer’s toolkit.
Ian Battersby
Senior Solutions Architect Global StudioOur large enterprise eCommerce application was built on the back on NHibernate. We want to ensure that the site is performing as quickly as possible when making remote calls. Knowing how many and what calls are made to the database when we have a complex domain model is especially important to us. We use NHProf to analyze calls during the development process what we see continually amazes us. Using NHProf as our primary tool for information gathering made the process simple and painless, no burrowing through log files. We tightened up database calls all over the application and in some spots saw a 10 fold increase in request time due to reduced network calls and optimized queries. If you’re doing development with NHibernate, NHProf is a must have, no questions asked.
Tim Barcz
Team and Technical Lead JP Cycles World’s Largest After Market Harley Davidson Parts DealerAs the author behind the NHibernate FAQ blog and frequent writer of articles and tutorials about NHibernate I often have to analyze in detail the behavior and the exact output generated by NHibernate in various usage scenarios. From the very beginning NHProf has been an invaluable help to me in this regard. NHProf can be and was a real eye opener in regard of how to correctly and optimally use NHibernate in different use cases. In our projects I was able to easily track down spots where NHibernate was used suboptimally with the aid of NHProf – as an example n+1-queries – and to fix those flaws quickly, resulting in a dramatic improvement of the response time. Even in more involved situations NHProf has shown its value. Lately we discovered an unexpected behavior in one of our applications. The application uses the 2nd level cache of NHibernate and the cache provider we used had a flaw. With NHProf we were able to quickly spot the flaw and once it was fixed verify the success. NHProf is one of my favorite tools and is more than worth every penny spent on it.
Gabriel Schenker
NHibernate FAQI recently purchased four copies of the Nhibernate Profiler for our engineering group in Oklahoma City. Our applications rely on the Castle::ActiveRecord and Nhibernate stack. Performance is very important to our customers but profiling and debugging database interactions has always been problematic. The NHibernate profiler from Hibernating Rhinos has finally given us the in-depth detailed data that we need to quickly find the most performance sucking queries and eliminate them. It’s interface is intuitive and the profiling information is above and beyond anything we would have expected.
Dan Pupek
Chief Systems Architect Advanced Systems Technology, Inc.As we introduce NHibernate into our integrated Intelligent Transport System (ITS) that manages traffic operations on motorways and surface streets, NHibernate Profiler provides us the best possible view into what NHibernate is doing under the covers, enabling us to improve the performance of our software and avoid common pitfalls. NHibernate Profiler is the perfect companion in the development of applications using NHibernate.
Jonathon Rossi
Transmax – Leading Australian Intelligent Transport System providerAs a consultant I pride myself on delivering maximum value to my clients. NH Prof helps me to do so by allowing me to quickly and easily verify that I am using NHibernate in the best manner possible. The peace of mind that NH Prof provides has made it become a critical tool for any project I work on which uses NHibernate.
Shane Courtrille
JSC ConsultingOur team is very new to NHibernate, so we were able to identify significant performance bottlenecks by using NH Prof. Not only did it guide us by providing helpful feedback to help improve the performance of our application, but it also worked as a great tool for understanding and learning NHibernate.
I thought I knew what NHibernate was doing under the covers. Then I got NHProf!
Mike Olivieri
As a team who is ramping up with Nhibernate, using NHProfiler has giving us the ability to not only spot performance bottleneck, but also our mapping errors. This tool has saved us countless hours and saved us from many headaches.
Derik Whitaker
Allscripts-MisysI recently purchased NHibernate Profiler after using NHibernate in one of our projects. The product is awesome and very well adapted to different configurations. It can be configured only on debug mode which allows us to only activate statistics on a development environment without modifying any code. We used it to know how NHibernate processed our queries and we found out all the application bottlenecks. Thus, if you care about performance tuning and product quality, this product is a must-have inside your toolbox. Moreover, the special beta offer makes the product an interesting deal. So what are you waiting for?
Franck Quintana
iFactureWithin barely 5 minutes of downloading, NHProfiler was up and running against our initial application. Within 10 minutes more we had identified a bad use of count against an ID and with the help NHProfiler provided we converted 3 very inefficient queries to a single roundtrip using NH Futures. Another 20 minutes work and we were able to identify and eliminate entirely a few hundred individual selects to the database. No other tool pays for itself as fast as NHProfiler
Casey Charlton
TBTQMy company bought 3 licenses and they have been worth every penny. We are currently performance tuning our app and have been able to easily see N+1 select issues with this tool. Being able to clearly see what NHibernate is doing makes troubleshooting mapping issues a breeze. I wouldn’t start an NHibernate project without NHibernate Profiler at this point. Also, the NHibernate Profiler development team helped me troubleshoot a minor issue that ended up being a video driver issue on my end, so I have to give them kudos for awesome customer support.

